Introduction
Wearables make passive sensing possible. Phones and watches now collect rich streams of data such as heart rate, movement, sleep, and location, quietly in the background at population scale with almost no effort from the user. That is a superpower for behavioral and health research: high-resolution time series gathered in real life, not just the lab.
Passive features like activity, sleep, physiological signals, and social rhythms show meaningful links with mental and physical health. With statistical modeling, we could combine these signals into risk scores, symptom estimates, and early-warning flags.
Physical Activity Monitoring
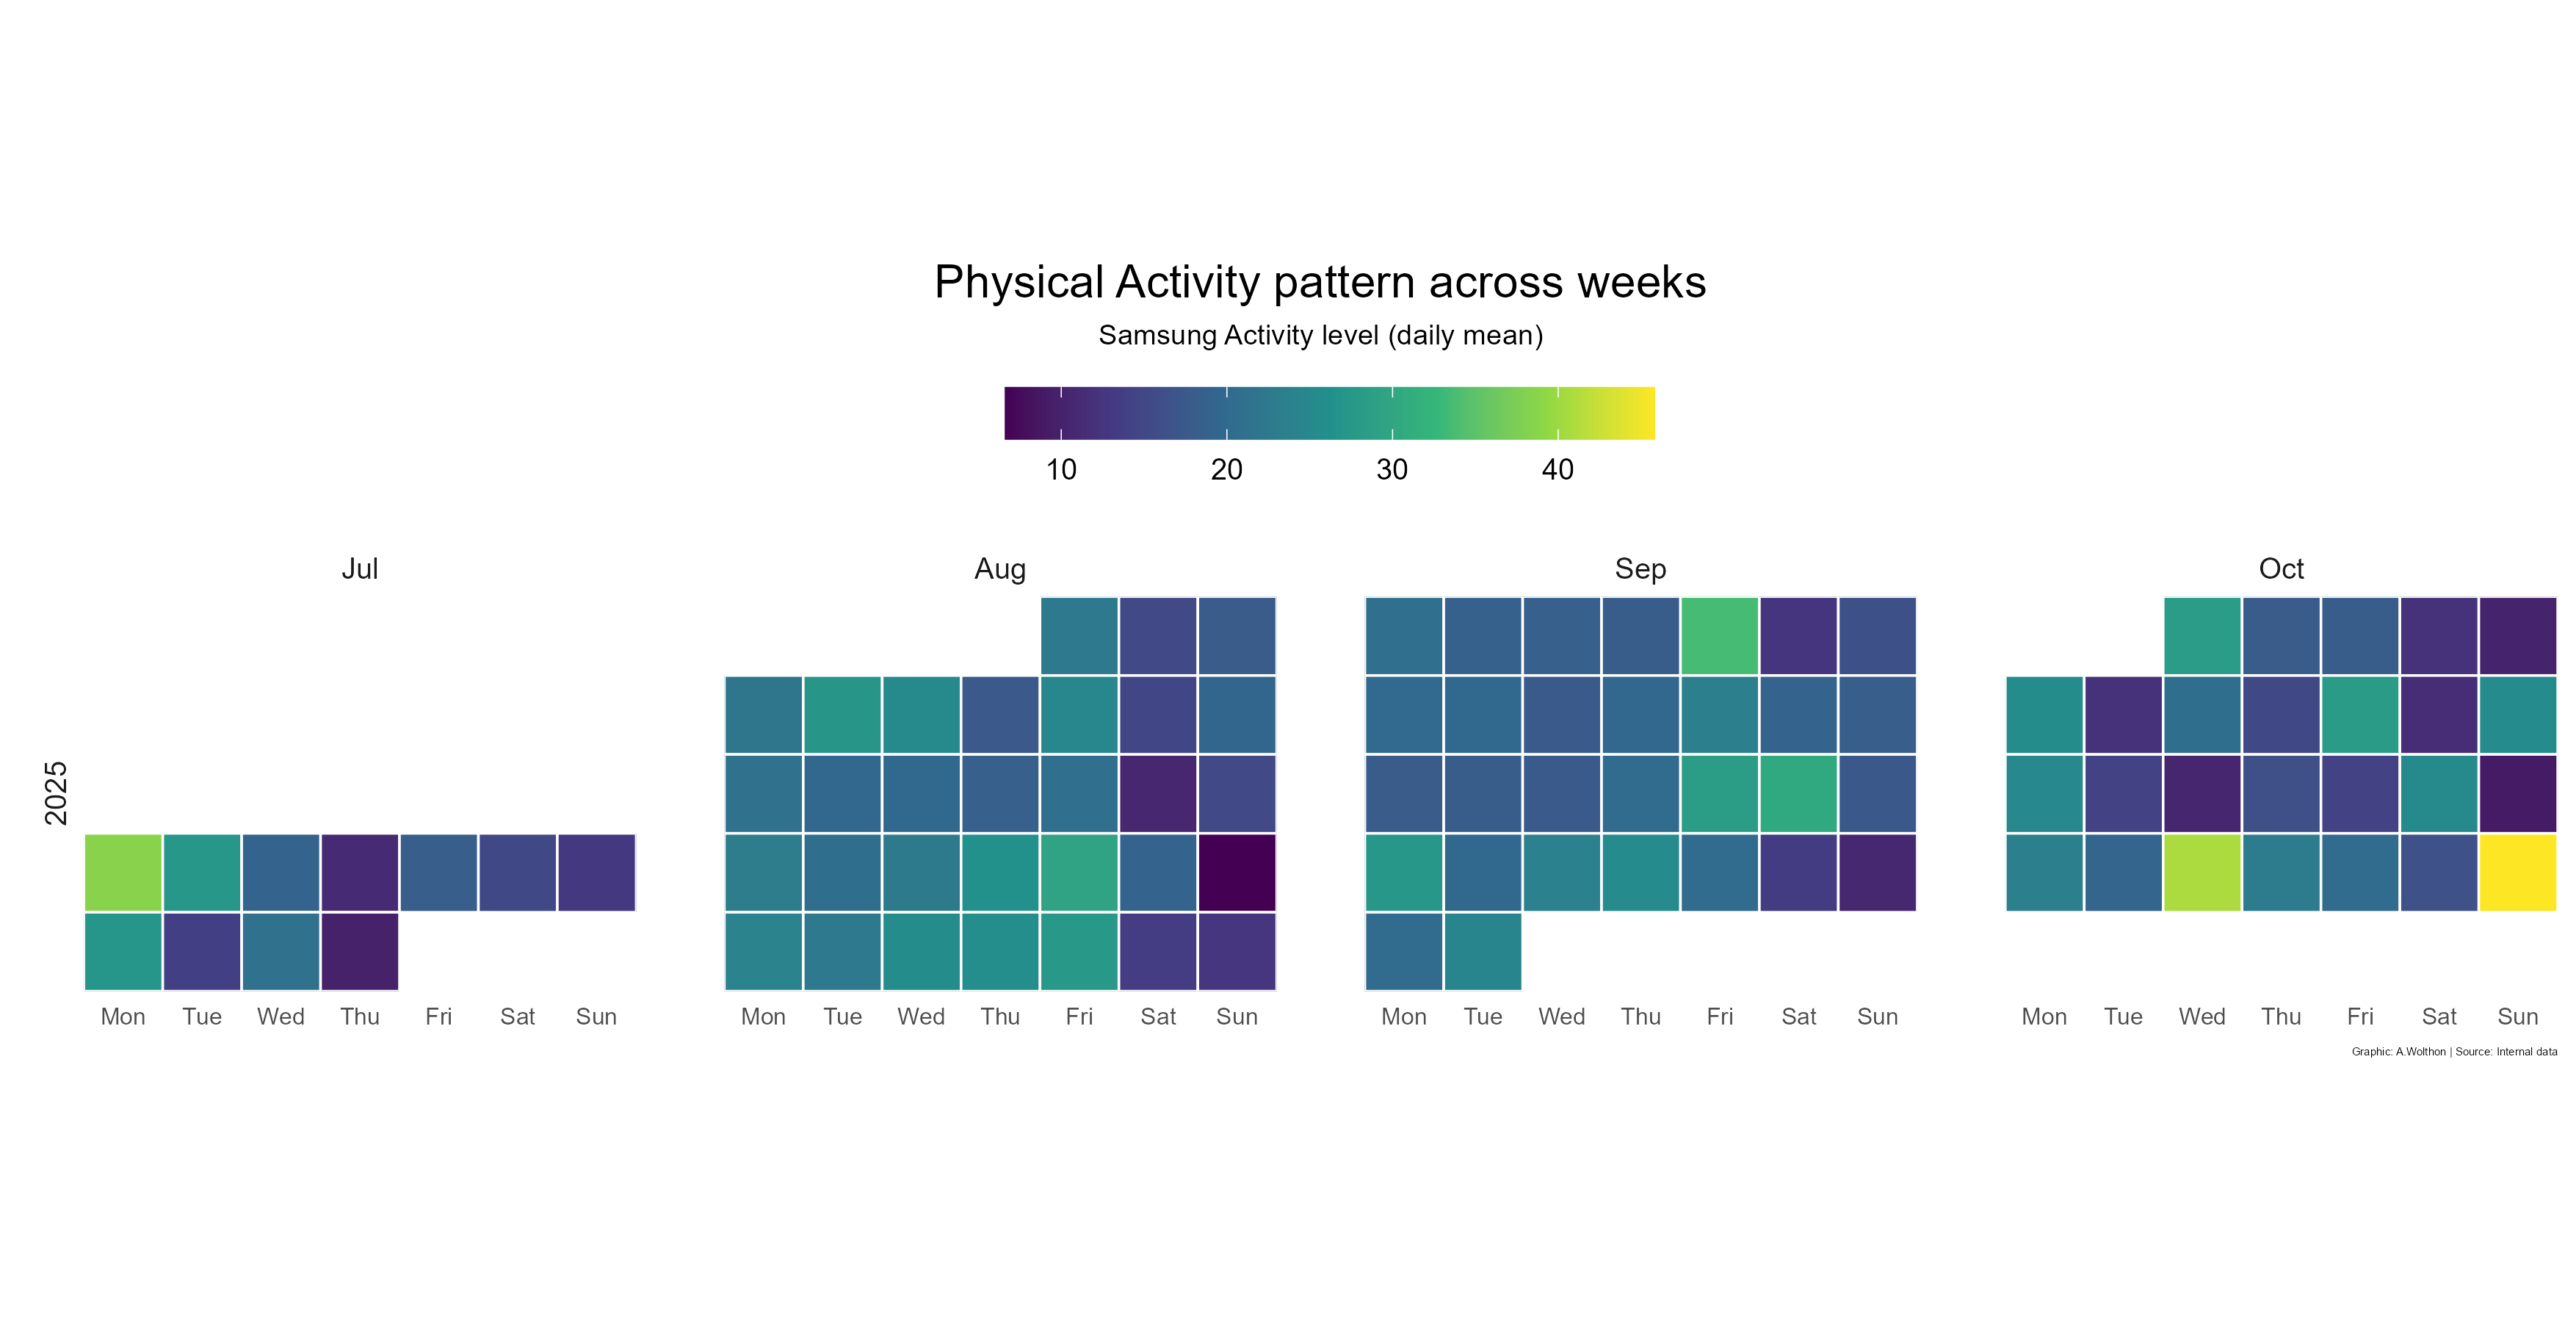
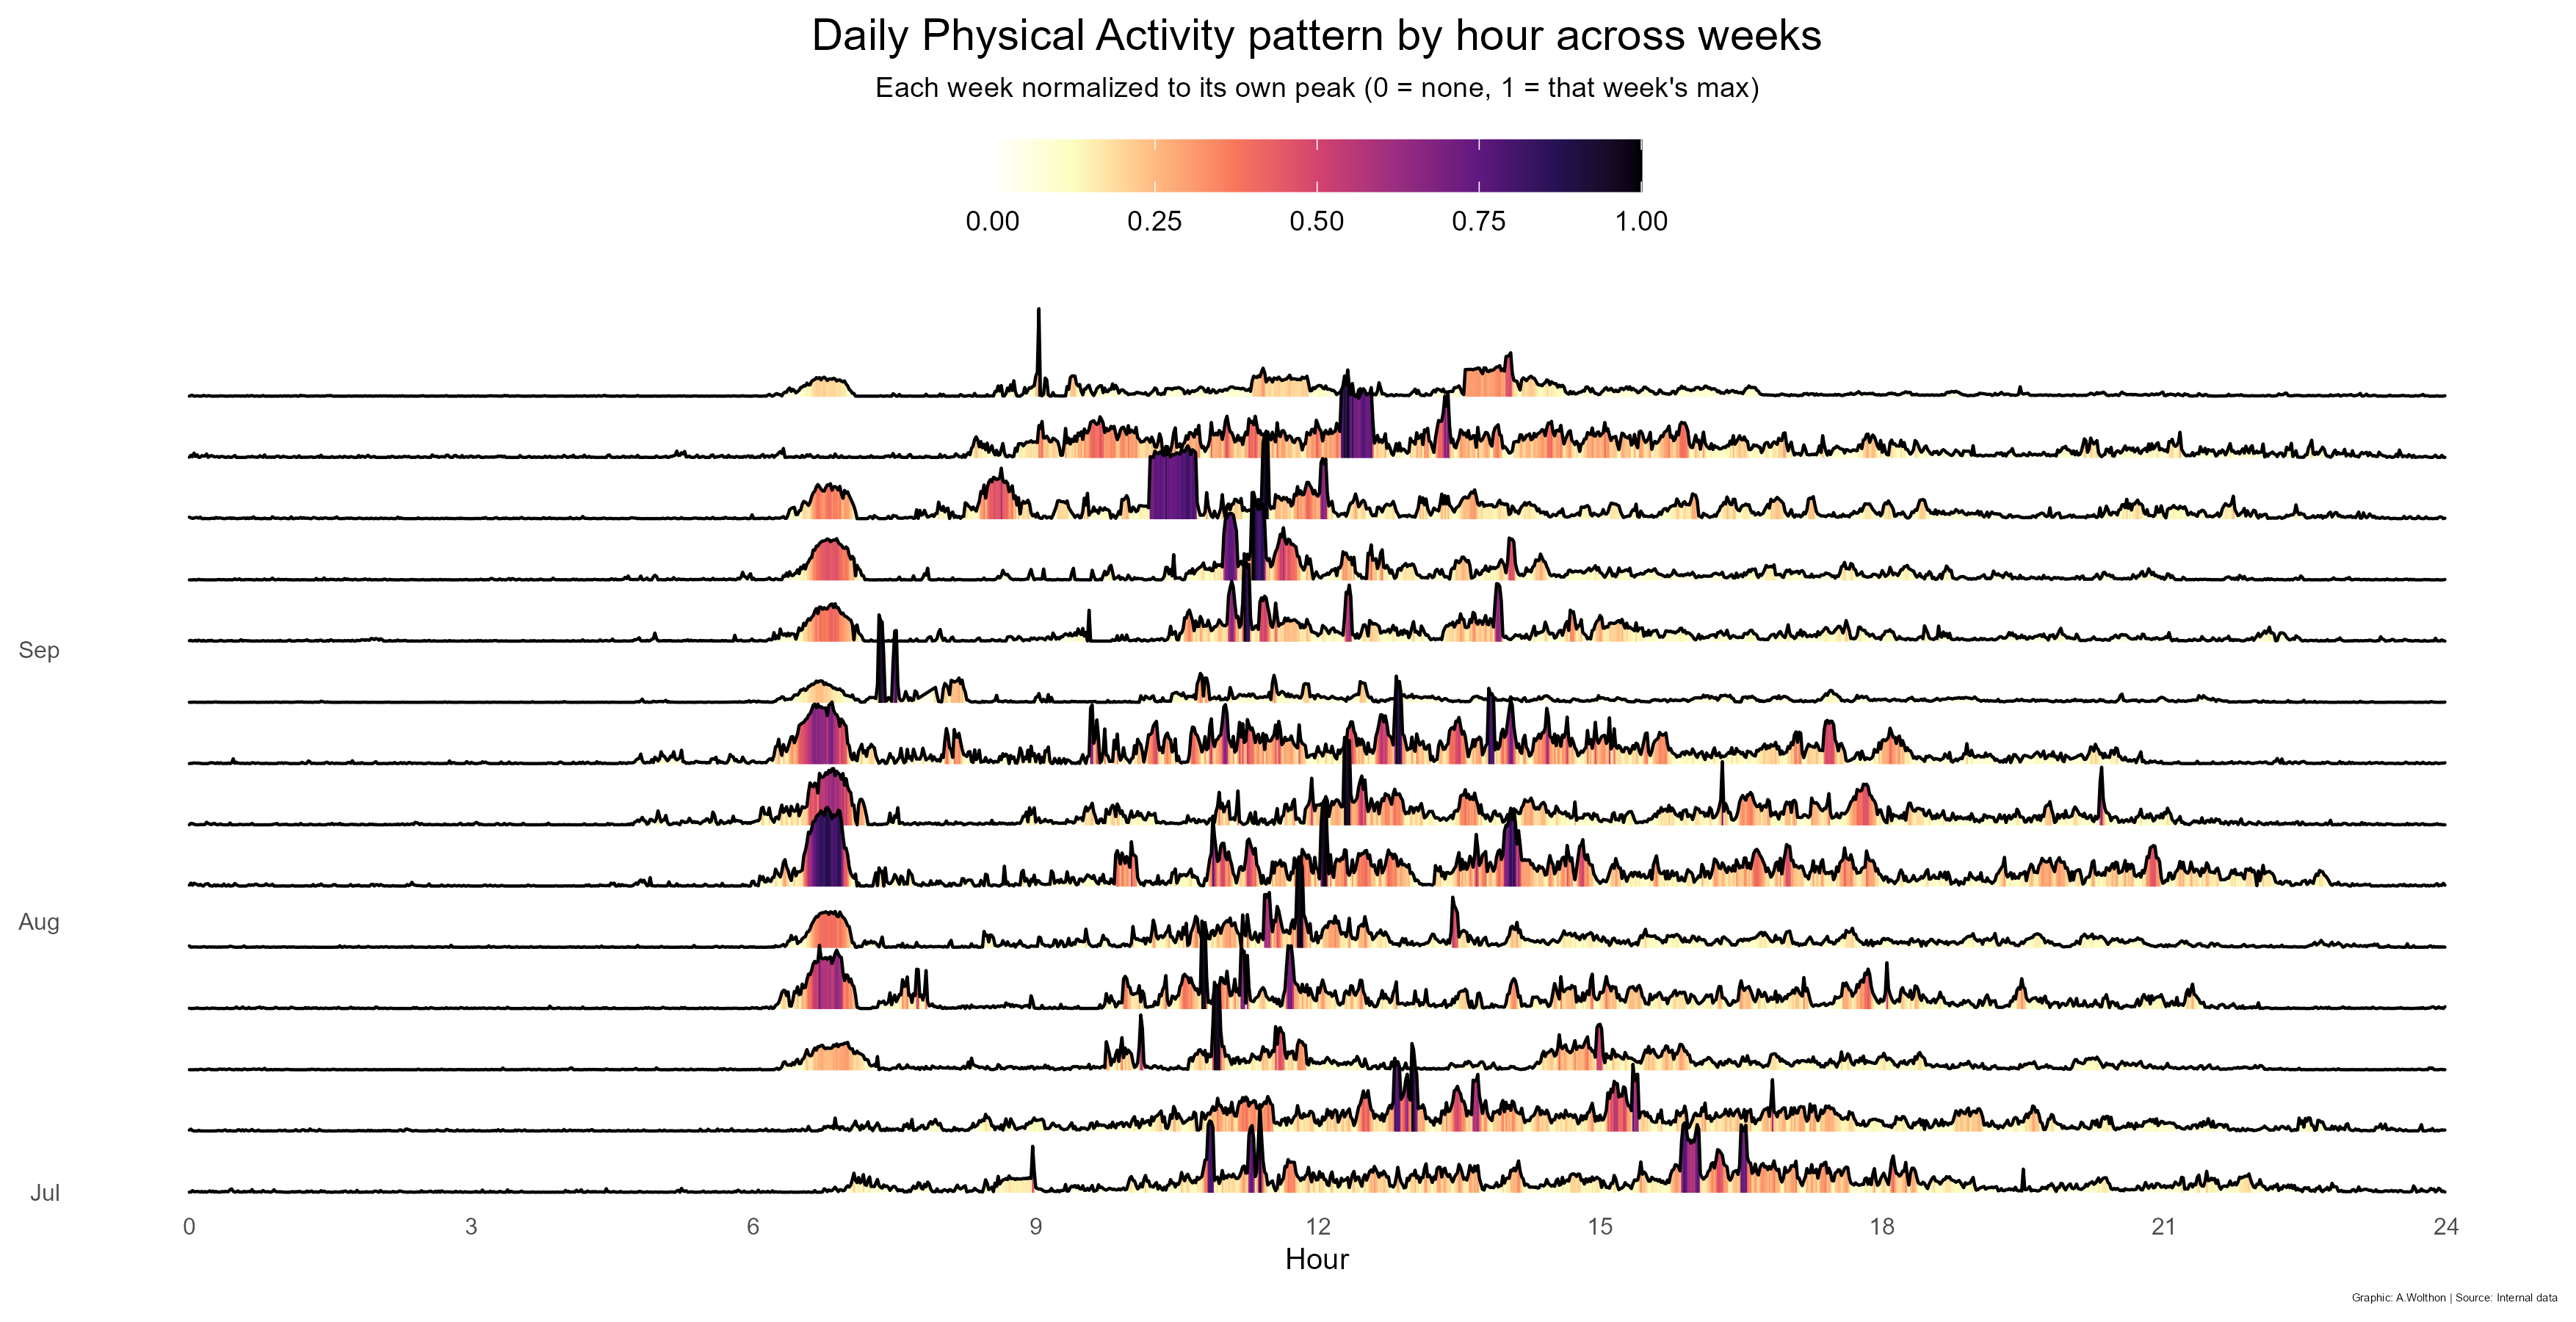
Physical activity can be monitored passively with wearables. For example, Samsung wearables report an hourly “activity level” metric. Although the method isn’t publicly specified (it may draw on accelerometer and/or heart rate data), we can use it to look at activity patterns across months and within days.




Heart Rate
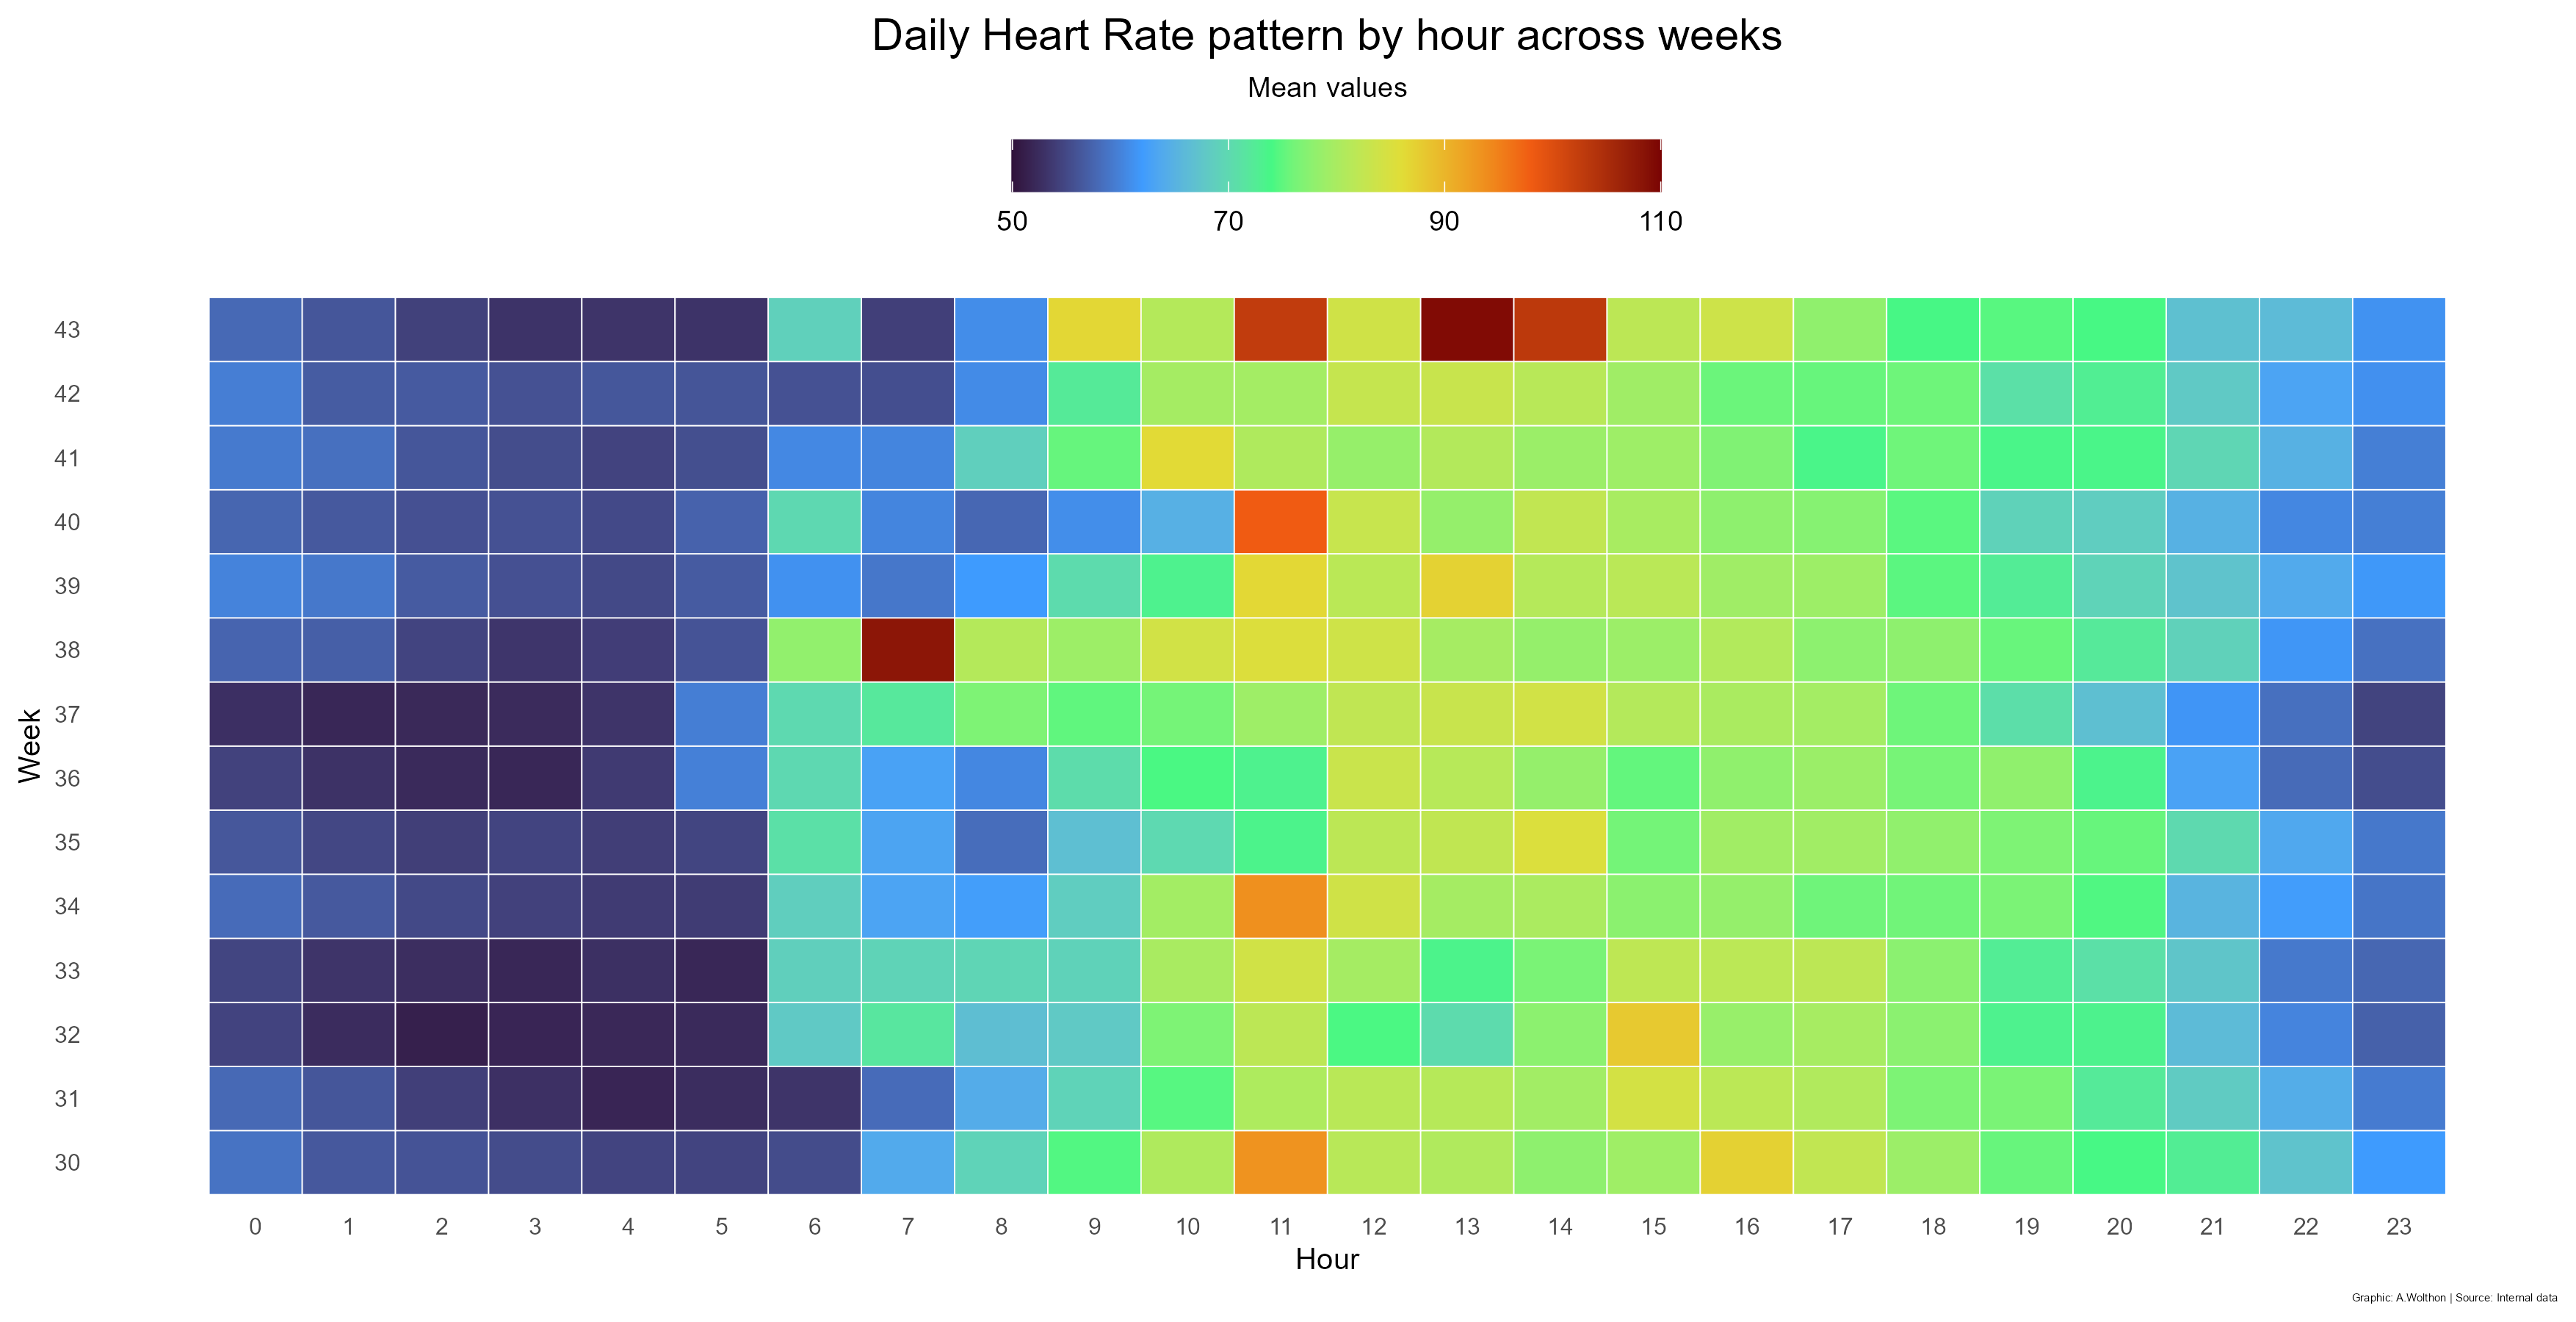
The data show a clear circadian rhythm: lowest overnight, a morning rise after waking, a midday plateau, and a gradual evening decline. Spikes are usually brief workouts or sensor hiccups. Small week-to-week drifts are expected with changes in sleep, training, illness, or stress.

HRV
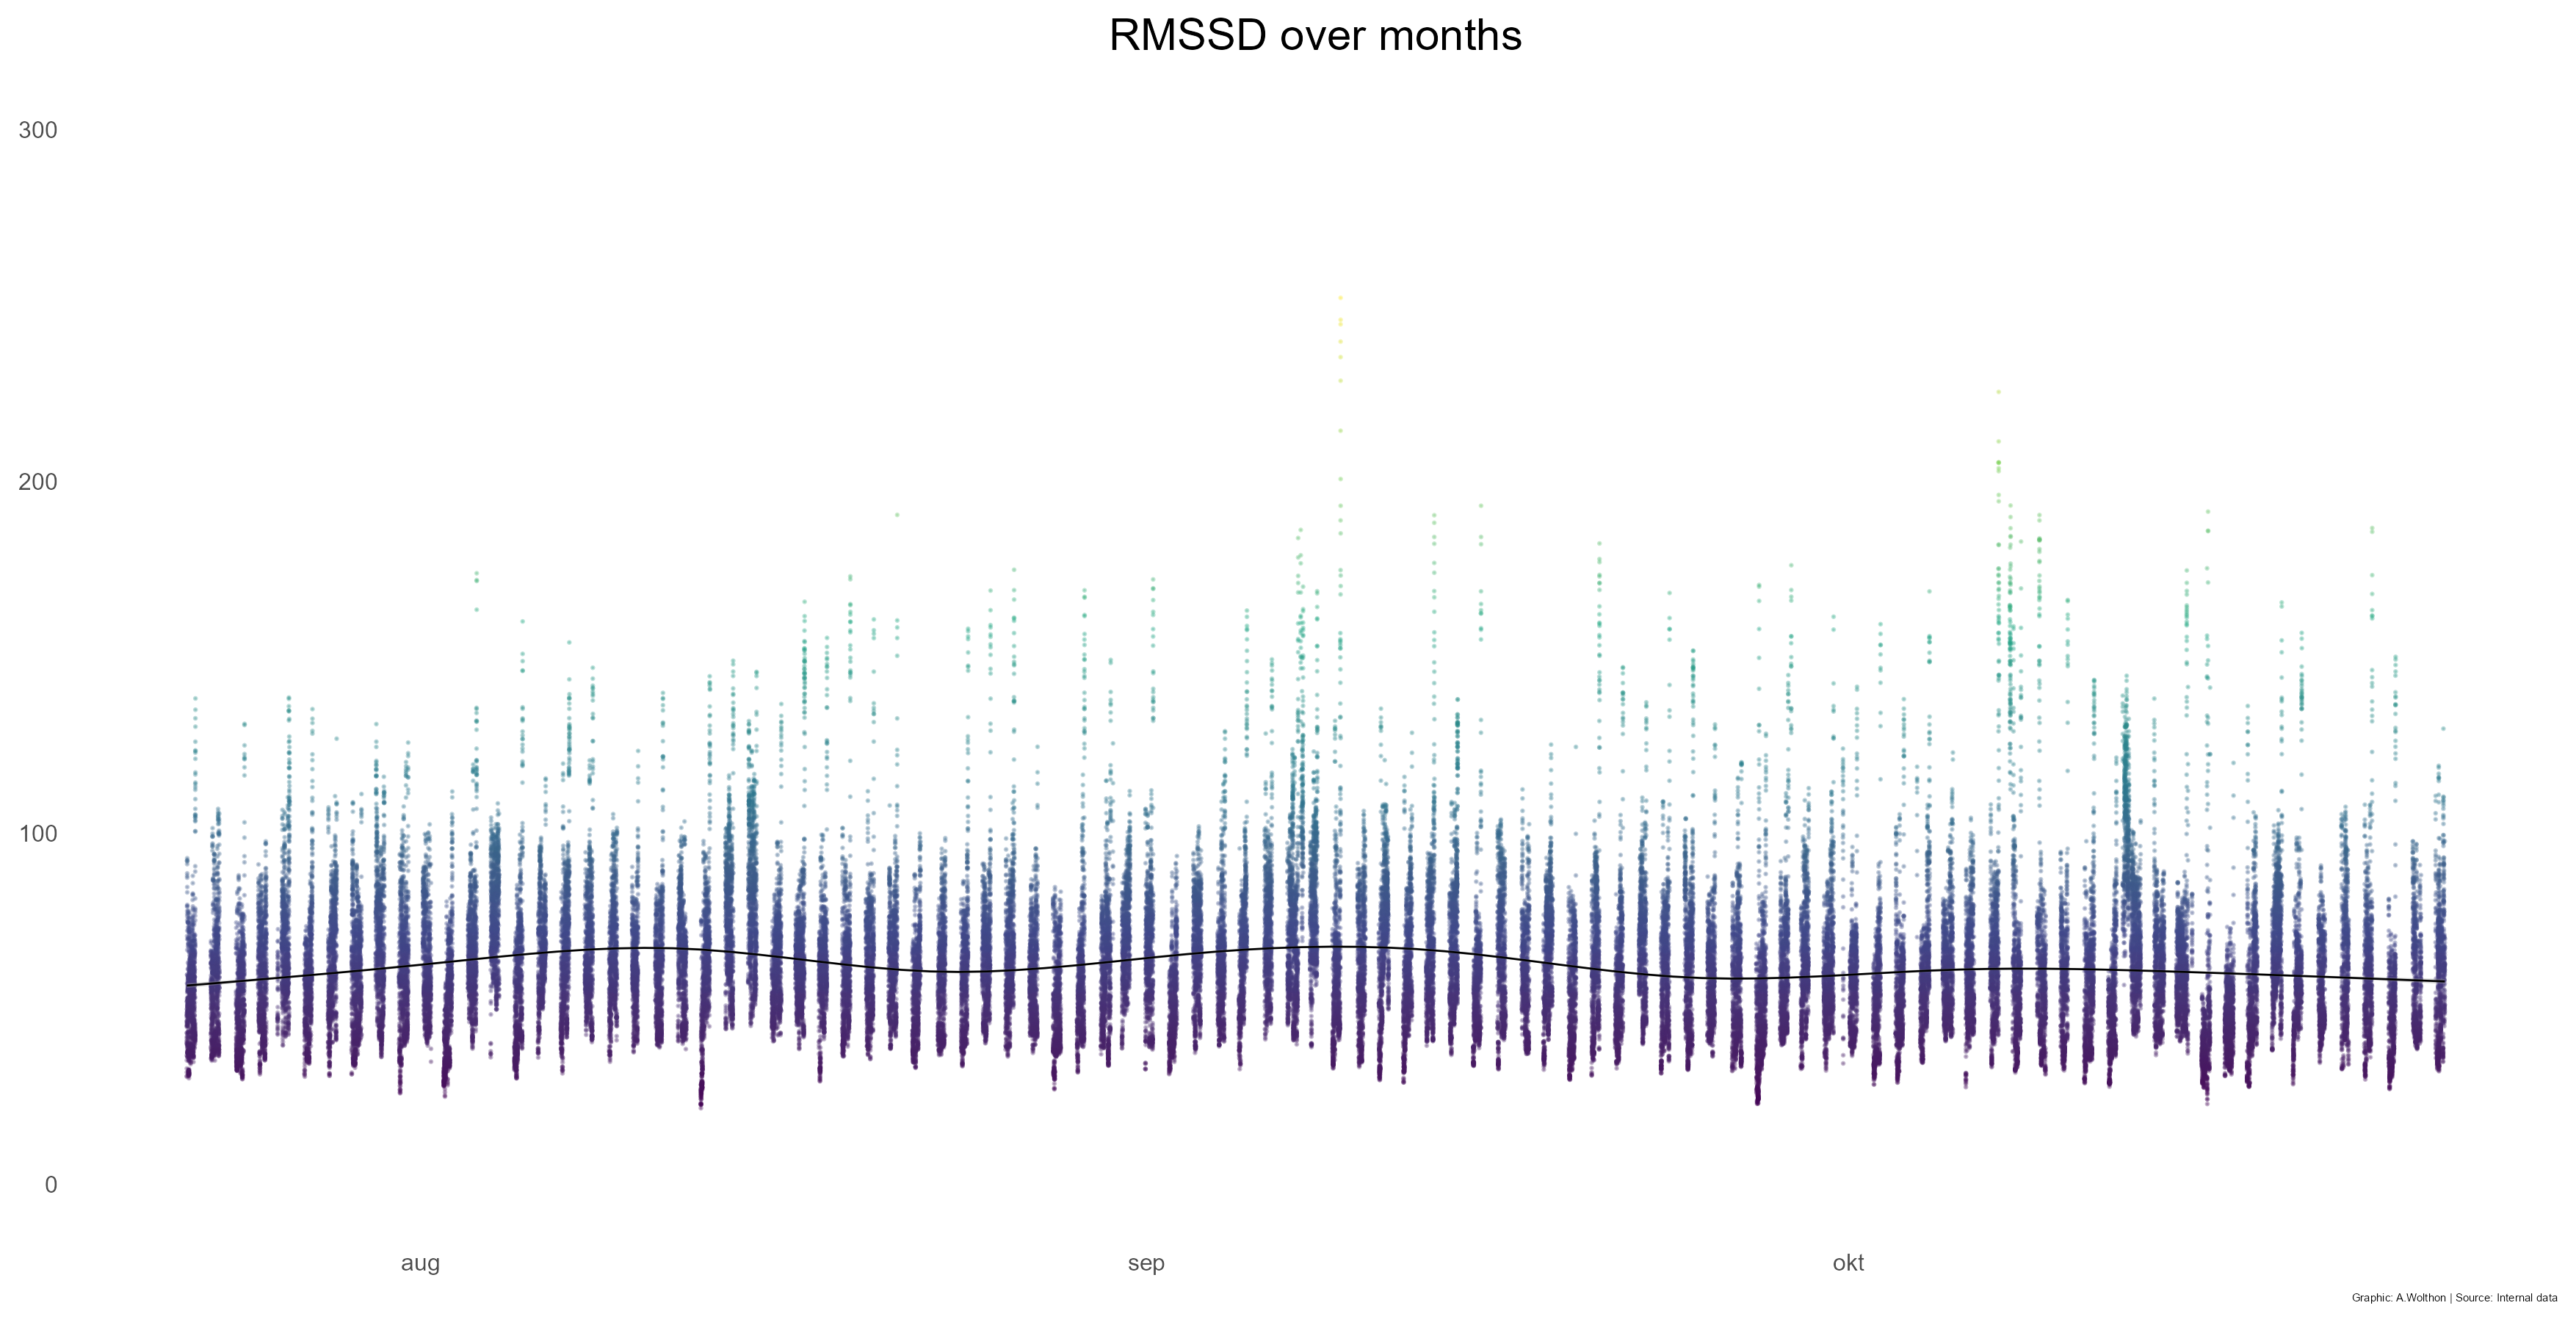
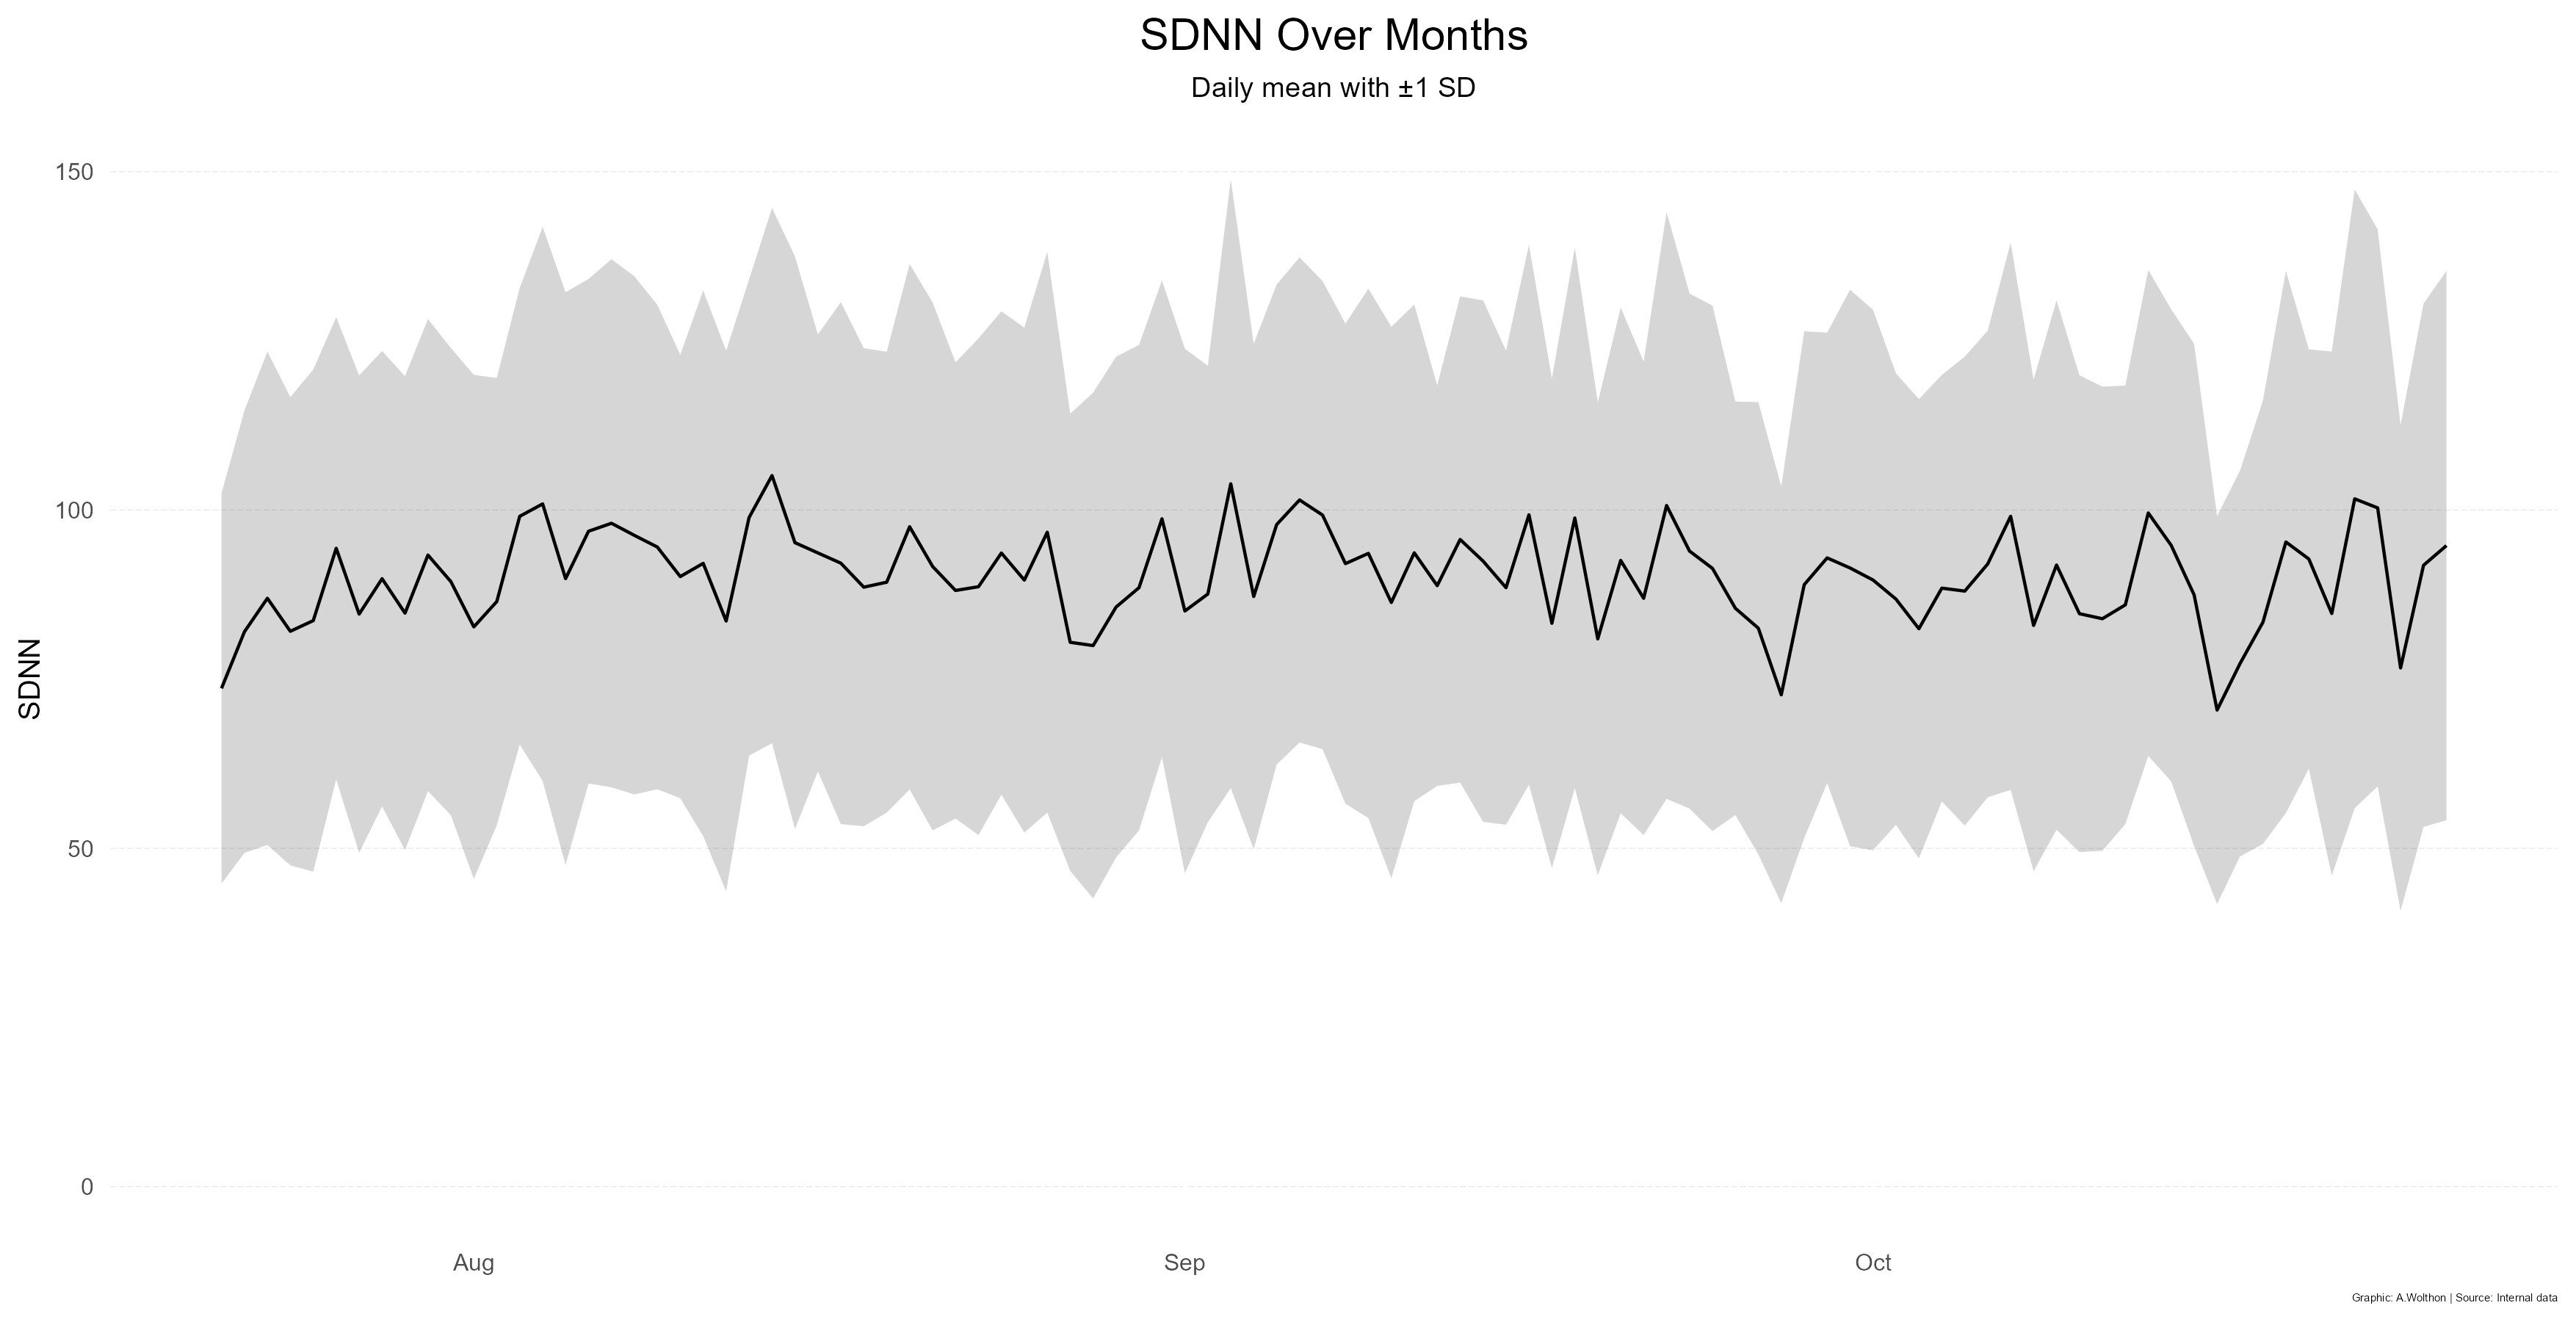
Samsung Watch 8 reports HRV during sleep, so the figures reflect nightly recovery rather than daytime stress. That’s useful because movement is low and PPG estimates are cleaner, but stage mix (REM vs NREM), bedtime, alcohol, illness, and training load can shift values from night to night. Here I summarize each night’s HRV (RMSSD, SDNN) during detected sleep, then track the nightly mean and its variability over time. Trends are best interpreted within-person and over several nights, not from single nights.


Validity
Passive sensing is convenient and time-efficient, but we still need to know how close it is to reference standards. In practice, that means asking, for example, how a watch’s activity-level estimates compare with a research-grade accelerometer (e.g., ActiGraph wGT3X-BT) and how wrist-based heart rate or HRV tracks against an ECG-derived R-R intervals. Below, I examine concurrent validity by comparing a modern wrist sensor with a chest strap in matched sessions, quantifying both bias and typical absolute error. Are wrist sensors always worse than chest straps?
I compared a Samsung Watch 8 (wrist optical sensor) against a Garmin HRM-Run chest strap (recorded via a Garmin watch) across three sessions done:
– Session A (Bike, 20 min): 4-min blocks at 32, 64, 95, 127, 159 W.
– Session B (Walk, 5 min): 5 km/h treadmill.
– Session C (Run, 30 min): 11 km/h treadmill.
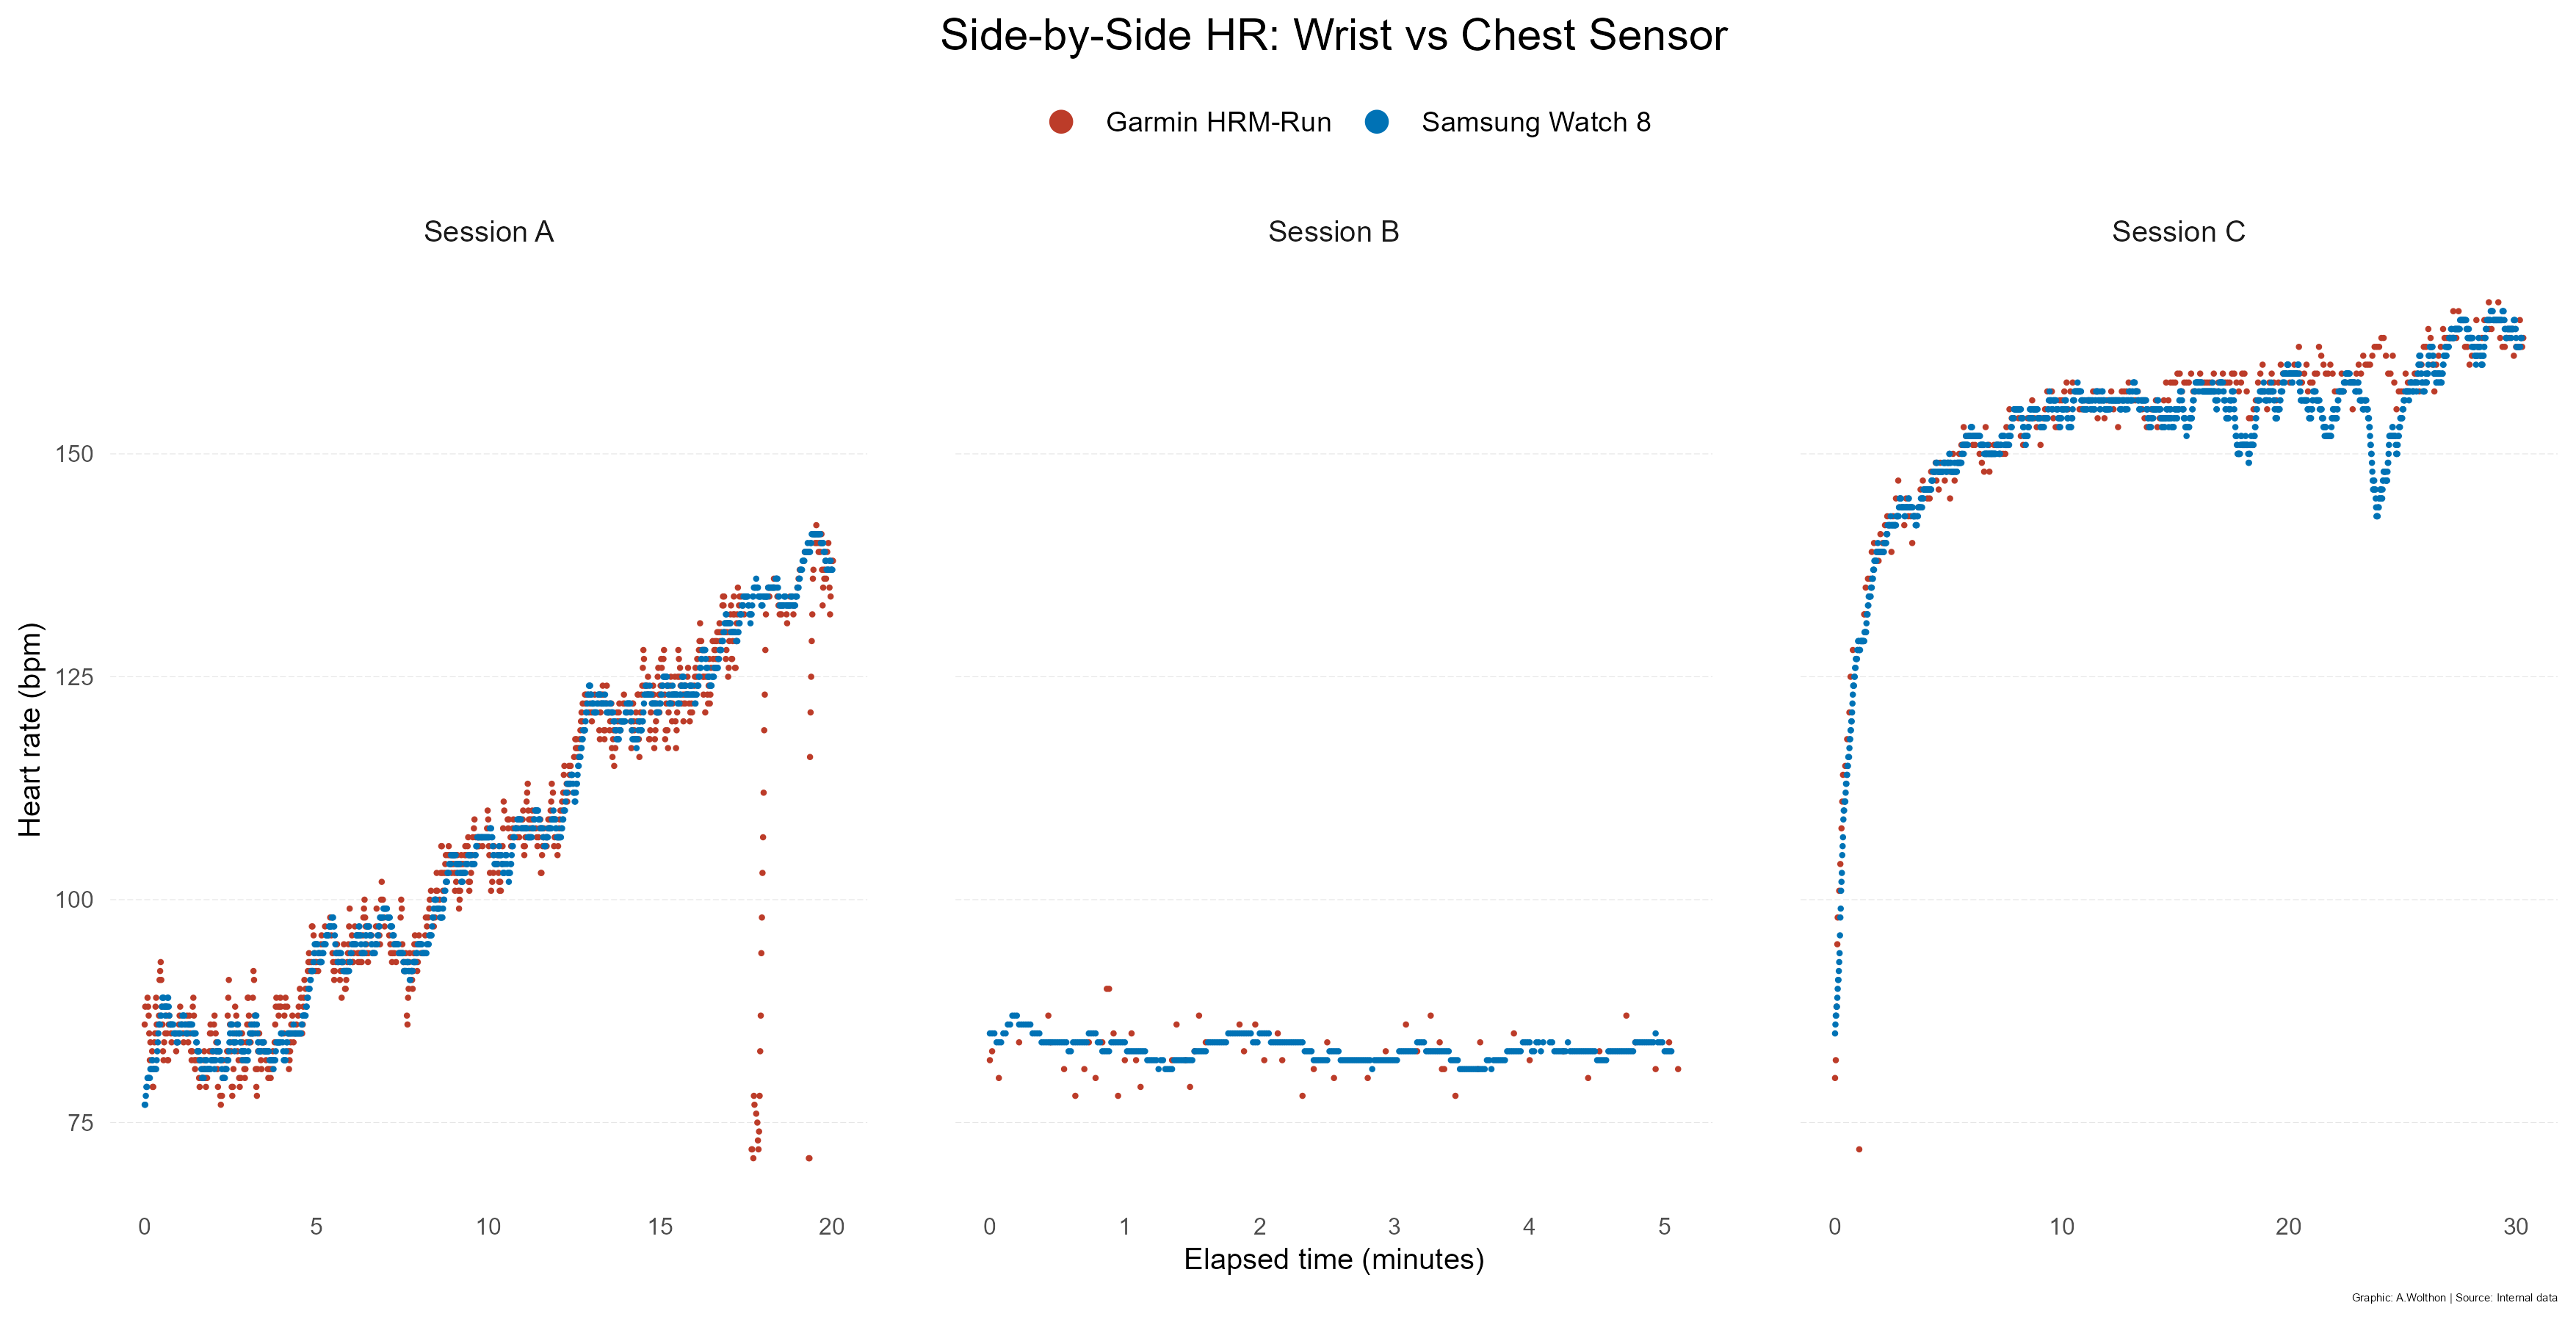
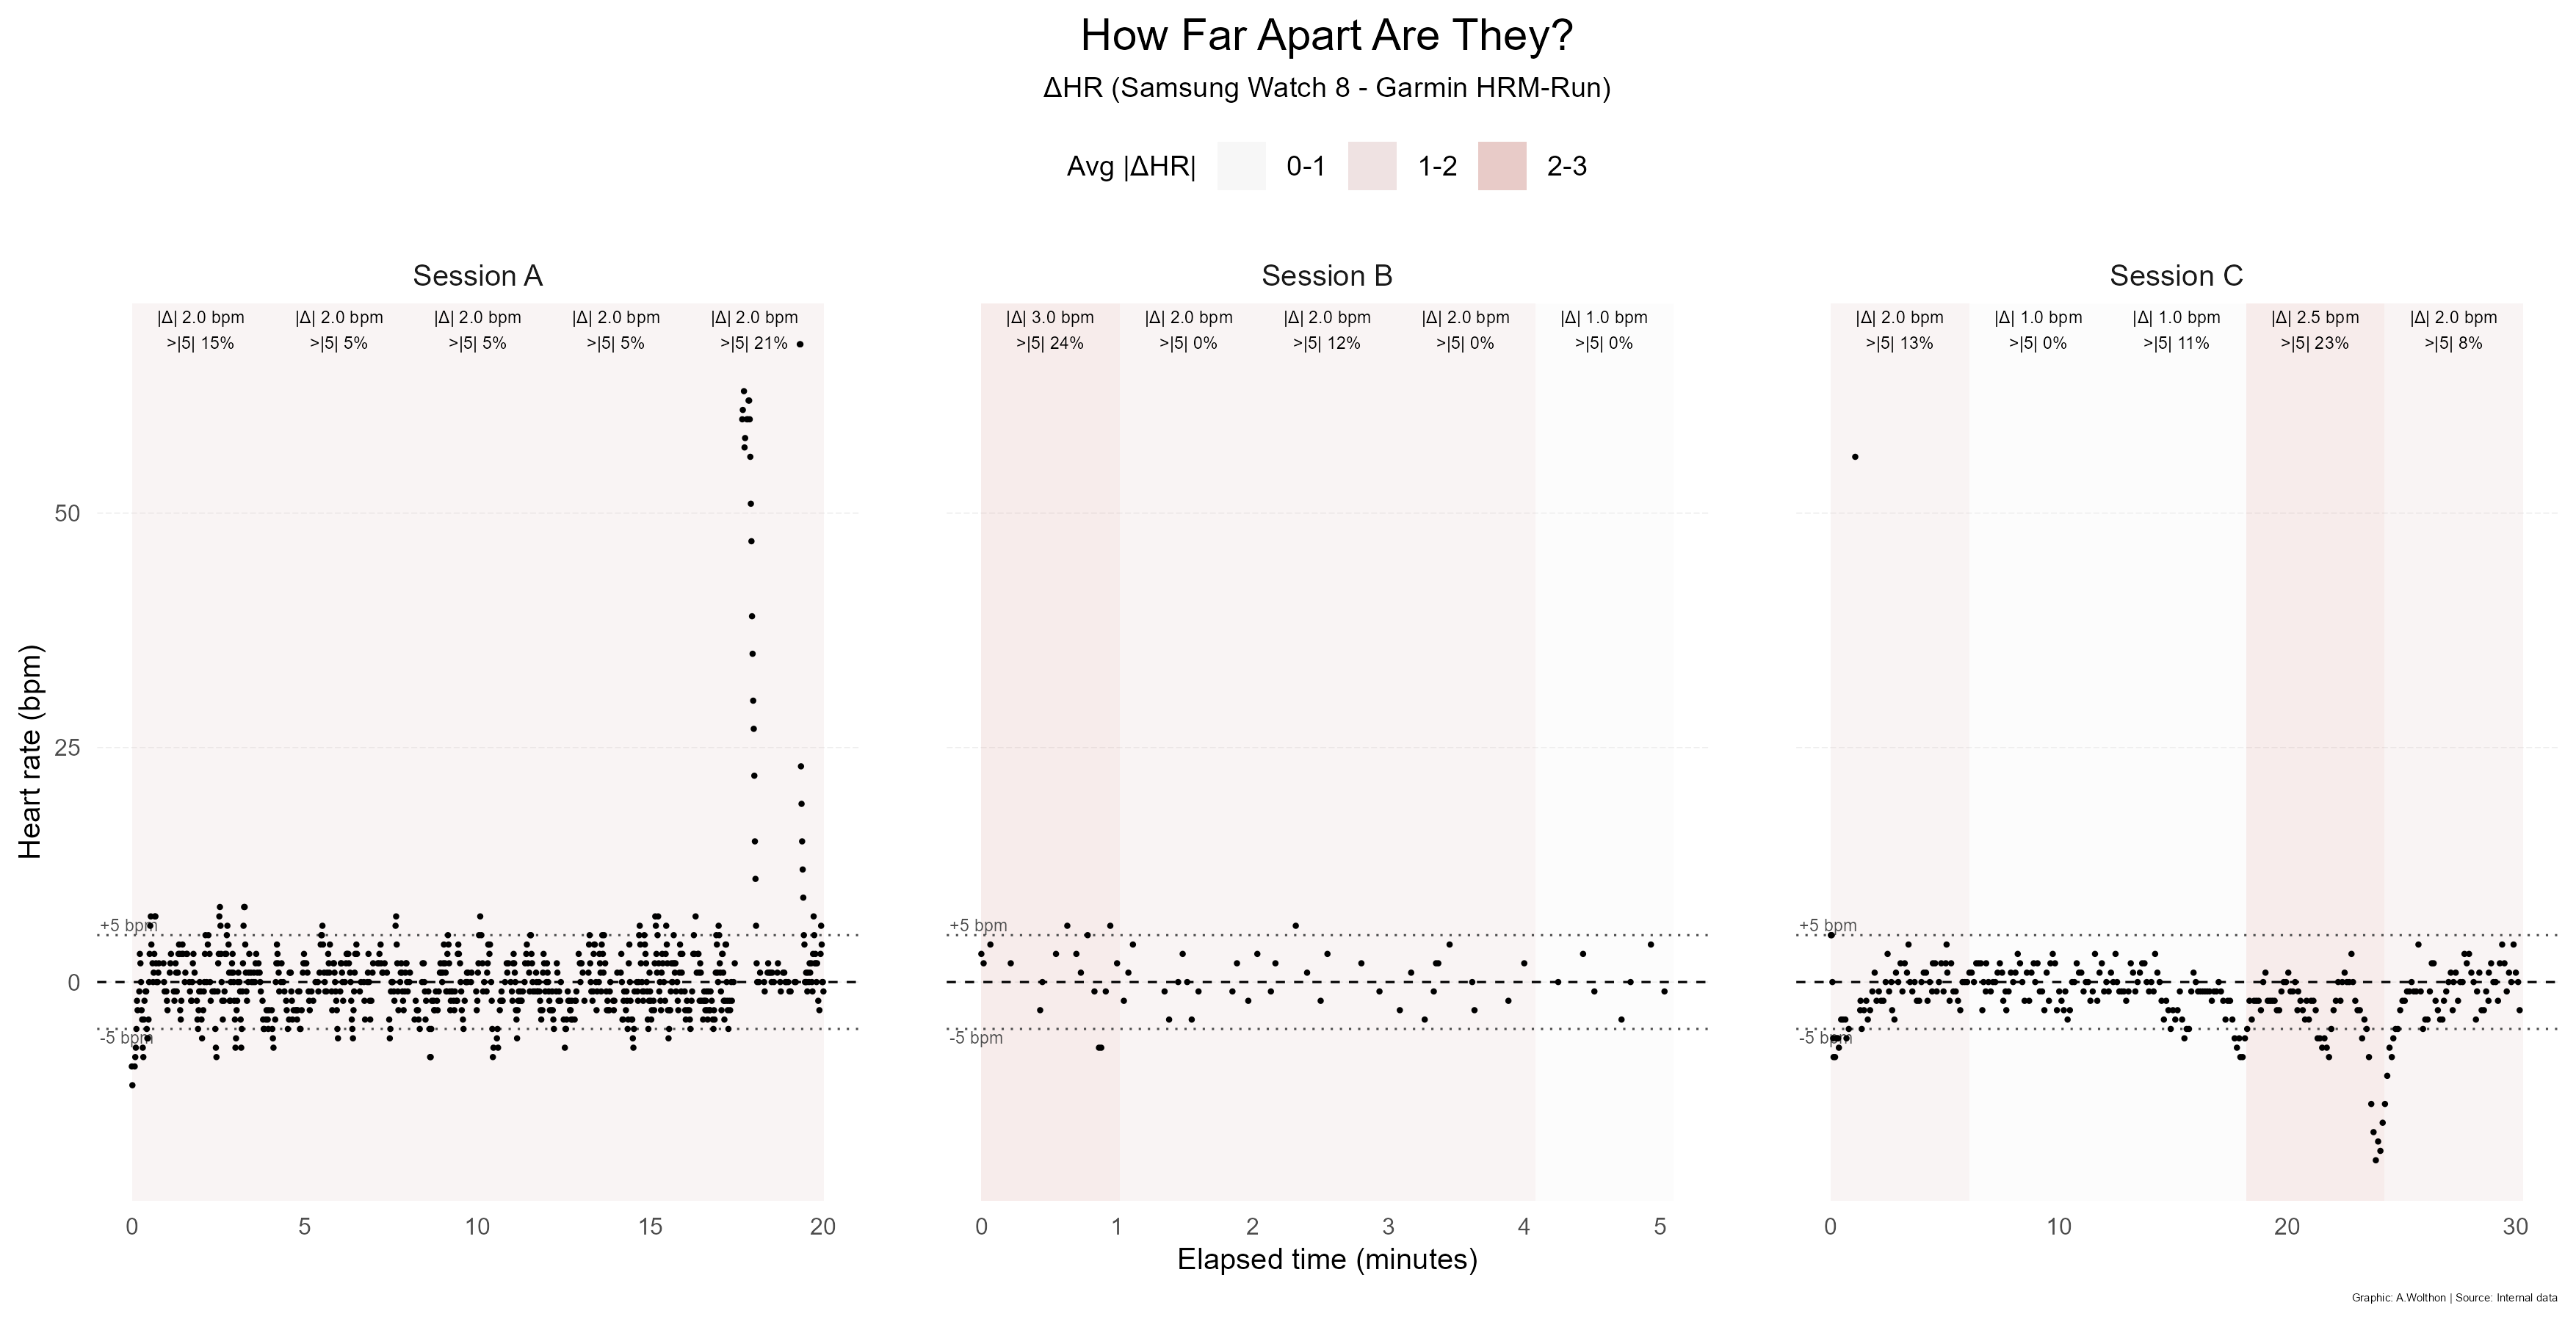
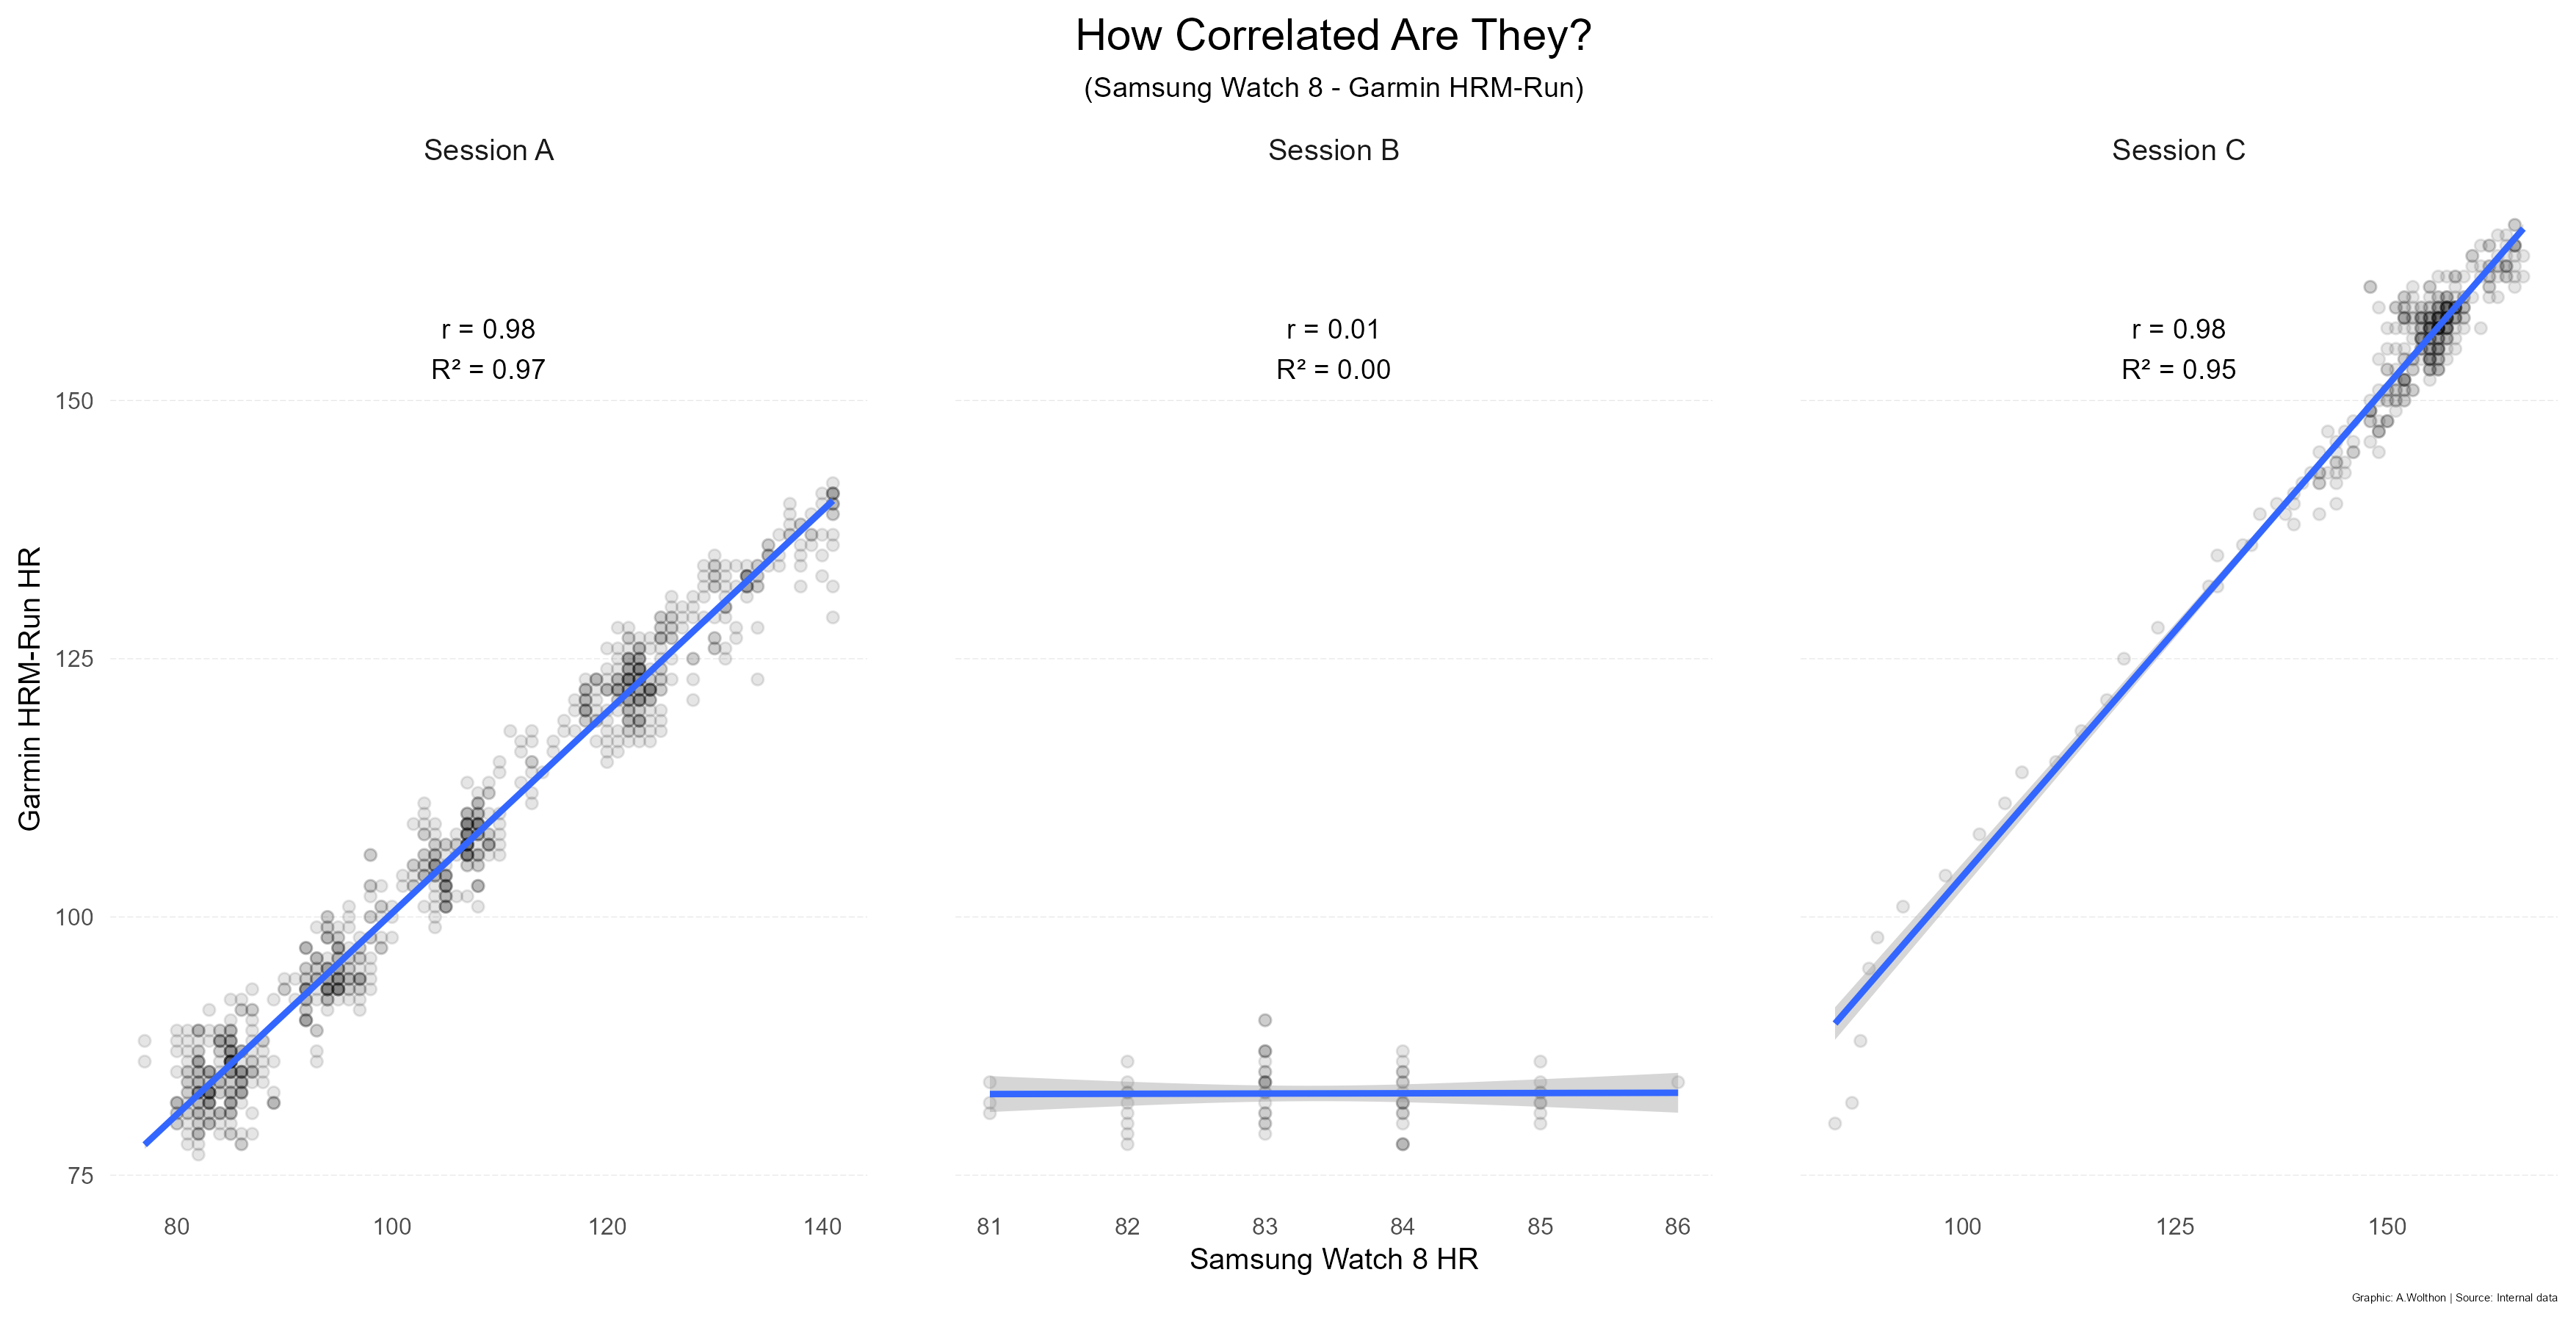
Across these examples, the wrist sensor was comparable to the chest strap, with small errors on average (1–3 bpm). Neither device is perfect, as each showed occasional artifacts (chest sensor dropouts in Session A, wrist sensor dropouts in Session C), but overall agreement was good. In Session B, heart rate varied very little, so correlation (which depends on variance) understated agreement even though absolute error stayed low. Interestingly, the wrist sensor had lower second-to-second variability, which may be more accurate than the chest sensor counterpart.
Session A
Mean difference ≈ 2 bpm. The chest strap exhibited higher second-to-second variability and brief dropouts (e.g., ~132 bpm → 13 s missing → < 80 bpm), which are unlikely under a constant load. After excluding obvious artifacts, correlation was very high (r ≈ 0.98).
Session B
Mean difference ≈ 1–3 bpm with very narrow HR range (~81–86 bpm). Because the range was so small, Pearson r (≈ 0.01) is uninformative. Again, the wrist sensor had lower second-to-second variability than the chest sensor.
Session C
Mean difference ≈ 1.0–2.5 bpm. The wrist sensor appeared to have lost signal for a short while resulting in dip in heart rate (≈ 155 → 146 bpm), but outside of that, agreement was strong and correlation high (r ≈ 0.98), similar to Session A.