Introduction
PC components tend to get really warm when used, and sophisticated cooling solutions such as vapor chambers, liquid metal, and water cooling can be used to minimize temperature buildup. Overly hot components may suffer from reduced performance (e.g., lower core clocks) due to thermal throttling, which is why minimizing temperature buildup is important. Desktop PCs generally find it easy to do this given their large cases, though smaller form factor PCs such as ITX cases will not be able to achieve the same level of cooling. The same can be said for laptops, which have fewer and smaller active fans than their desktop PC counterparts. Despite laptop components not providing the same level of performance, all else being equal, they still run much hotter than the desktop alternative.
Given that laptop fan speeds can be manually adjusted to run at different RPMs based on the workload, an interesting question arises: Can manually modifying fan curves yield better temperature management compared to factory defaults? This experiment will explore whether custom fan curve settings can improve cooling efficiency over factory defaults by testing three different fan profiles on a laptop using a Single-Subject Experimental Design (SSED).
Method
Design
Using a Single-Subject Experimental Design with a latin square approach, 3 different fan curves will be tested:
(A) Factory Defaults: The pre-set fan curve by the manufacturer.
(B) Linear from 20°C to 80°C: Fan speed increases linearly with temperature, starting at a lower RPM at 20°C and reaching higher RPM at 80°C.
(C) All Max: Fans run at maximum speed at all times to ensure maximum cooling potential

To stress the laptop’s components and accurately assess each fan curve’s cooling performance, the Cinebench 2024 benchmark suite will be used. Cinebench is known for pushing CPU and GPU performance, providing a reliable measure of cooling effectiveness. To minimize carryover effects between the fan curve settings, we will ensure a sufficient washout period between each condition by restarting the laptop and having it rest for 10 minutes. This allows the laptop to return to a baseline temperature and performance state before the next test begins, reducing the influence of residual heat from previous tests. Although carryover effects are the primary concern, we will also use a Latin square design to minimize order effects through counterbalancing and randomization. By varying the order of fan curve testing across sequences, we can ensure that any potential learning or fatigue effects are evenly distributed.
The Latin square design used will be:
Sequence 1: B > C > A
Sequence 2: A > B > C
Sequence 3: C > A > B
Subject
The subject of this experiment is an ASUS ROG Strix Scar laptop (G533ZW-LN086W) with the following specifications:
12th Gen Intel Core i9-12900H
14 Cores (6P + 8E), 20 Threads @ 2.92 GHz (Turbo 5 GHz)
NVIDIA GeForce RTX 3070 Ti Laptop (1410 MHz, 8 GB, 125 W + 25W boost)
Windows 11, 64 Bit, Core (build 22631.3880)
Software
G-Helper: This utility allows for precise adjustments of fan speeds based on temperature thresholds, enabling testing of three fan curve profiles: factory defaults, a linear increase from 20°C to 80°C, and maximum fan speeds.
Cinebench 2024 suite: Employed to stress test the CPU and GPU. Cinebench simulates intensive workloads, ensuring consistent stress conditions for evaluating the cooling performance of each fan curve setting.
LibreHardwareMonitor: Used for data logging of system temperatures and fan speeds at one-second intervals. Key parameters monitored included temperatures, core clocks, load, power, memory and voltages. This high-frequency data collection enabled precise analysis of the cooling efficiency of each fan curve profile.
Piloting
A pilot test was conducted using Cinebench 2024 suite to evaluate system performance metrics and determine suitability for this experiment. The results showed that most outcomes spanned from minimum to maximum levels, confirming Cinebench as a suitable stress test for this experiment.
Results
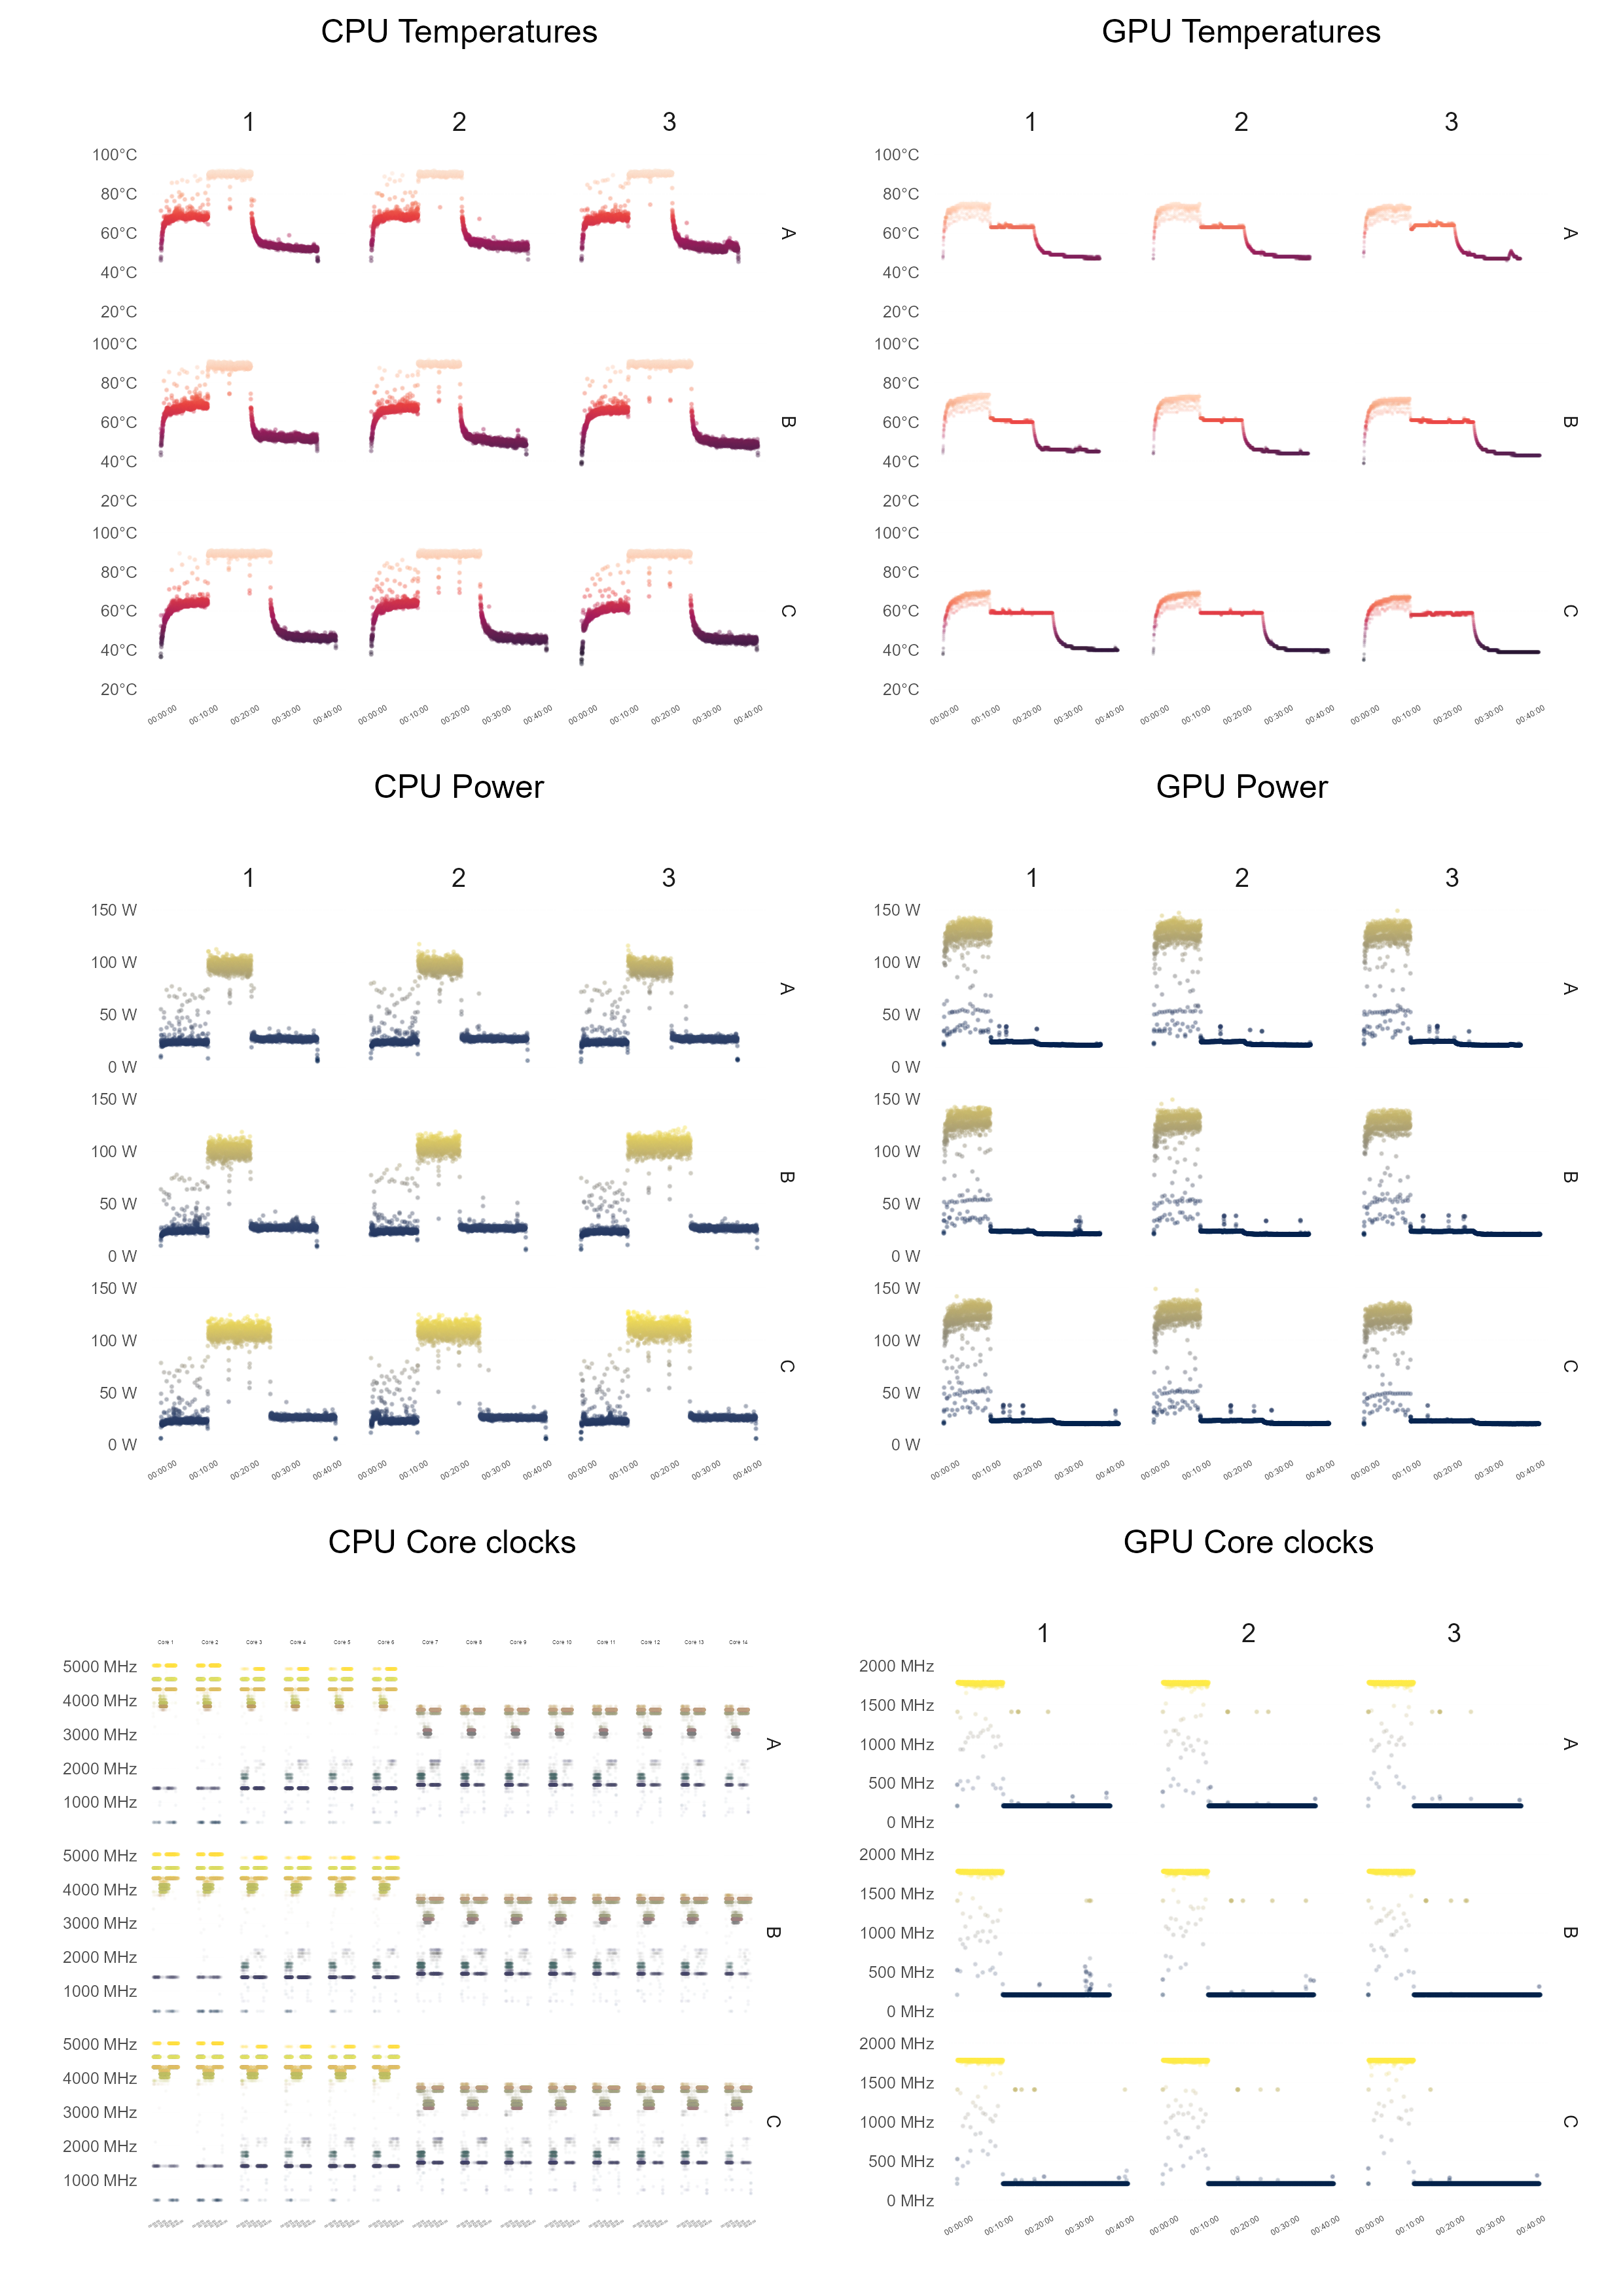
The time-series data above reveals three distinct phases corresponding to the different stress tests conducted in the Cinebench 2024 suite: GPU test, CPU Multi-Core test, and CPU Single-Core test. To enable a more detailed analysis of the data for each stress test, it will be essential to label the data according to these phases. As an exploratory step, we can apply an unsupervised classification algorithm, specifically K-Means clustering, to automatically identify these phases. While K-Means performed reasonably well in distinguishing the different phases, it was not perfect. Ultimately we decided to manually label the data based on the known timing of each test and the expected system performance metrics for each phase.


Thermal and performance analysis
The analysis of the fan curve settings revealed significant differences in thermal management and performance outcomes for the ASUS ROG Strix Scar laptop. The fan curve set to maximum speed at all times resulted in notably lower temperatures for both the CPU and GPU compared to the factory default settings. Specifically, the CPU temperatures decreased by 1.0 to 7.1°C, while GPU temperatures showed reductions of 4 to 8°C. These reductions in thermal metrics indicate that the factory default settings are less effective in dissipating heat, potentially leading to increased thermal throttling.
The decrease in temperatures with the max fan setting corresponded with an increase in CPU clock speeds by approximately 7.9%. This performance enhancement suggests that the lower temperatures enabled the CPU to operate more efficiently, minimizing thermal throttling and allowing for higher processing speeds. However, this performance gain came at the cost of increased power consumption, with the CPU drawing approximately 13% more power compared to the factory default settings. This increase in power usage highlights a trade-off between thermal management and energy efficiency.
Performance improvements were further reflected in the Cinebench 2024 multi-core scores, where the max fan setting achieved scores of 1114, 1117, and 1121. These scores were higher than those obtained with the linear fan setting, which recorded scores of 1085, 1100, and 1104, and the factory default setting, which resulted in scores of 1068, 1066, and 1061. These results indicate that the default fan curve may contribute to thermal throttling, thereby reducing overall system performance. Although the max fan setting provides technical benefits in terms of performance, the real-world implications of these improvements may be negligible, as the differences may not translate into significantly better performance in typical use scenarios.
Practical considerations
Despite the thermal and performance benefits associated with the max fan setting, there are practical considerations that must be addressed. The increased fan speed results in significantly higher noise levels, comparable to that of jet engines, making this setting intolerable for extended use. The noise generated by the fans at maximum speed detracts from the user experience, underscoring the need for a more balanced approach to fan curve settings that considers both performance and acoustic comfort.
Given the marginal real-world performance gains observed with the max fan setting, it may be more advantageous to optimize fan curves based on tolerable noise levels. One potential approach involves designing a fan curve that minimizes noise during idle conditions, maintains acceptable sound levels during typical workloads, and allows for maximum fan speeds only at critical temperatures. This approach would aim to balance thermal management, performance, and noise levels, enhancing the overall user experience.
Recommendations
Based on this experiment we can suggest some recommendations for optimizing fan curve settings. First, fans should be configured to operate silently or at very low speeds when the system is idle, reducing ambient noise and improving user comfort. During standard workloads, the fan speed should be adjusted to maintain effective cooling without exceeding tolerable noise levels. Finally, fans should be set to maximum speed only when the system reaches critical temperatures to prevent thermal throttling and maintain performance under intense workloads.
Conclusion
The findings of this experiment highlight the trade-offs between cooling performance, noise levels, and power consumption in laptops. While the max fan setting may offer superior thermal management and performance benefits, the associated noise levels limit may not be practical for everyday use. A more balanced fan curve that prioritizes acoustic comfort alongside thermal efficiency may provide a better solution for most users, ensuring that performance improvements do not come at the cost of user experience.